Environmental Metrics
Environmentally Responsible Operations
The disclosures below are reported in line with our operational reporting boundary, including our joint venture activities. Data for all offices, sites and sales suites (including show homes) is provided.
| Environmental Prosecutions | Unit | 2024/25 | 2023/24 | 2022/23 | 2021/22 | 2020/21 | Notes |
| Environmental prosecutions |
# | 0 | 0 | 0 | 0 | 0 |
Number of environmental prosecutions in the year.
|
|
Environmental fines and penalties
|
£ | 0 | 0 | 0 | 0 | 0 | Monetary cost of environmental fines and penalties in the year. |
| Scopes 1 and 2 Greenhouse Gas (GHG) Emissions | Unit | 2024/25 | 2023/24 | 2022/23 | 2021/22 | 2020/21 | Notes |
| Scope 1 emissions | tCO2e | 582 | 609 | 713 | 1,974 | 2,353 | Direct emissions from natural gas, directly purchased fuels and business travel in company owned and company leased vehicles (utilising conventional fuels as an energy source). Fugitive emissions from refrigerant gas losses have been included since 2022/23, whilst gas oil emissions have no longer been relevant since April 2022. Our emissions were 3,808 tCO2e in our SBT baseline year of 2018/19. |
| Scope 2 (location-based) emissions | tCO2e |
4,445 | 4,636 | 4,510 | 5,858 | 6,385 | Indirect emissions from electricity, heat and business travel in company owned and company leased vehicles (utilising electricity as an energy source). |
| Scope 2 (market-based) emissions |
tCO2e | 314 | 308 | 250 | 237 | 196 | Indirect emissions from electricity, heat and business travel in company owned and company leased vehicles (utilising electricity as an energy source). Market-based emissions take into account Berkeley’s purchase of Renewable Energy Guarantees of Origin (REGOs) to certify that 100% of UK electricity is backed by a renewable source (i.e. solar, wind or hydro power). Our emissions were 172 tCO2e in our SBT baseline year of 2018/19. |
| Scopes 1 and 2 (location-based) emissions | tCO2e |
5,027 | 5,245 | 5,223 | 7,832 | 8,738 | Location-based emissions resulting from our office, sales, site and business travel activities. |
| Scopes 1 and 2 (market-based) emissions | tCO2e | 896 | 917 | 963 | 2,211 | 2,549 | Market-based emissions, resulting from our office, sales, site and business travel activities, taking into account our procurement of renewable electricity in the UK. Our emissions were 3,980 tCO2e in our SBT baseline year of 2018/19. |
| Change in scopes 1 and 2 (market-based) emissions compared to our 2018/19 SBT baseline year | % | -77 | -77 | -76 | -44 | -36 | Our validated science-based target (SBT) is to reduce absolute scopes 1 and 2 (market-based) GHG emissions 50% by FY2030 from a FY2019 base year. We achieved this target seven years early and have submitted an updated target to the Science Based Targets initiative (SBTi). |
| Scopes 1 and 2 Energy Consumption | Unit | 2024/25 | 2023/24 | 2022/23 | 2021/22 | 2020/21 | Notes |
| Total energy consumption (including non-renewable and renewable) | MWh | 25,745 | 27,505 | 30,420 | 36,335 | 36,833 | Energy consumption associated with scopes 1 and 2 emissions has been calculated and reported on a net calorific value (CV) basis. This total figure includes energy from non-renewable and renewable sources. |
| Non-Renewable energy consumption | MWh | 3,463 | 3,224 | 3,372 | 8,679 | 10,027 | Energy consumption from non-renewable sources, including diesel, liquefied petroleum gas (LPG), natural gas and petrol. Prior to April 2022, this figure also included gas oil. |
| Renewable energy consumption | MWh |
22,282 | 24,281 | 27,048 | 27,656 | 26,806 | The energy consumption from renewable sources, including biodiesel HVO (Hydrotreated Vegetable Oil), on-site generated renewable energy and purchased electricity in the UK which is backed by Renewable Energy Guarantees of Origin (REGOs). |
| Biodiesel HVO (Hydrotreated Vegetable Oil) | MWh | 2,170 | 3,343 | 5,020 | 1,185 | 251 | Energy from biodiesel HVO (Hydrotreated Vegetable Oil) used across our sites. The Berkeley Group requires directly purchased biodiesel HVO to be produced from waste or by-products (e.g. used cooking oil, animal fat residue or ‘tall oil’ from wood pulp manufacture) and certified via a recognised sustainability scheme. |
| Renewable electricity | MWh | 20,112 | 20,938 | 22,028 | 26,471 | 26,555 | Energy from renewable electricity used across our sites, offices and sales suites, including on-site generated renewable electricity (139 MWh in 2025) and UK purchased electricity backed by Renewable Energy Guarantees of Origin (REGOs). |
| Renewable energy consumption |
% | 87 | 88 | 89 | 76 | 73 | Percentage of total energy consumption from renewable energy sources. |
| Purchased electricity backed by Renewable Energy Guarantees of Origin (REGOs) | % | 98.2 | 98.3 | 98.7 | 99.0 | 99.2 | Percentage of total global purchased electricity consumption backed by Renewable Energy Guarantees of Origin (REGOs). |
| Purchased electricity in the UK backed by Renewable Energy Guarantees of Origin (REGOs) | % | 100 | 100 | 100 | 100 | 100 | Percentage of total UK purchased electricity consumption backed by Renewable Energy Guarantees of Origin (REGOs). |
| Scope 3 Greenhouse Gas (GHG) Emissions | Unit | 2024/25 | 2023/24 | 2022/23 | 2021/22 | 2020/21 | Notes |
| Scope 3 (categories 1 and 11) emissions | tCO2e | 501,825 | 519,040 | 574,709 | 638,017 | 548,962 | Indirect emissions that occur in our value chain for material scope 3 categories, which are category 1: Purchased goods and services (55% of 2019 baseline year scope 3 emissions) and category 11: Use of sold products (36% of 2019 baseline year scope 3 emissions). Our emissions from categories 1 and 11 were 585,690 tCO2e in our baseline year of 2018/19. |
| Scope 3 (category 1: Purchased goods and services) emissions | tCO2e |
265,769 | 304,476 | 321,314 | 369,515 | 358,344 | Estimated emissions arising as a result of purchased goods and services calculated using two raw data sources for the reporting year; spend data and contractor fuel purchase data. |
| Scope 3 (category 11: Use of sold products) emissions |
tCO2 | 236,056 | 214,564 | 253,395 | 268,502 | 190,618 | We use the Dwelling Emission Rate (DER) of legally completed homes in the reporting year to estimate their carbon impact over a lifetime period of 60 years. |
| Scope 3 (categories 1 and 11) emissions intensity | tCO2e/100 sq m | 157 | 169 | 161 | 177 | 206 | Scope 3 (categories 1 and 11) emissions per 100 square metre of legally completed floor area. Our emissions intensity was 171 tCO2e/100 sq m in our baseline year of 2018/19. |
| Percentage change in scope 3 (categories 1 and 11) emissions intensity compared to our 2018/19 SBT baseline year | % | -8 | -1 | -6 | 4 | 20 | Our validated science-based target (SBT) is to reduce scope 3 purchased goods and services and use of sold products GHG emissions 40% per square metre of legally completed floor area by FY2030 from a FY2019 base year. |
| Water Usage | Unit | 2024/25 | 2023/24 | 2022/23 | 2021/22 | 2020/21 | Notes |
| Water withdrawals | m3 | 166,773 | 182,285 | 201,979 | 236,234 | 240,232 | The total volume of water withdrawn across our offices, sites and sales suites (including show homes). This is calculated using water meter readings and/or invoices. |
| Water consumption | m3 | 9,271 | 9,560 | 11,991 | 12,699 | 12,251 | The total volume of water estimated to have been consumed across our offices, sites and sales suites (including show homes). Berkeley’s water consumption is limited and includes use in on-site mortar silos. |
| Water discharges | m3 | 157,502 | 172,725 | 189,988 | 223,535 | 227,981 | The total volume of water estimated to have been discharged across our offices, sites and sales suites (including show homes). Berkeley’s water consumption is limited, with the majority of water withdrawals in the reporting period being discharged (e.g. for dampening down activities). |
| Waste Generation | Unit | 2024/25 | 2023/24 | 2022/23 | 2021/22 | 2020/21 | Notes |
| Total waste generated (including construction, demolition and excavation wastes) | tonnes | 274,747 | 388,765 | 596,921 | 734,320 | 382,824 | Total non-hazardous and hazardous waste produced by our sites. This includes Berkeley Group and contractor wastes from demolition, excavation and construction works. |
| Total waste classified as hazardous | tonnes | 23,385 | 4,082 | 4,799 | 5,669 | 2,602 | Hazardous waste generation is dependent on project activities during the year, including materials contained within any buildings demolished and any contaminated land encountered during groundworks. |
| Total waste diverted from landfill | % | 96 | 96 | 97 | 90 | 95 | Total waste generated (including hazardous) that has been diverted from landfill. |
| Total waste reused, recycled or recovered (excluding incineration with energy recovery) | tonnes |
238,249 | 370,108 | 578,501 | 659,658 | 362,227 | Total waste generated (including hazardous) that has been reused, recycled or recovered, with the exception of incineration with energy recovery. |
| Total waste incinerated with energy recovery |
tonnes | 836 | 132 | 131 | 0 | 111 | Waste sent to an incineration plant for combustion with resulting heat energy recovered. Note that prior to 2024/25, this figure included waste sent directly to incineration only. |
| Total waste disposed | tonnes | 35,662 | 18,525 | 18,289 | 74,662 | 20,486 | Total waste generated (including hazardous) that has been disposed, rather than reused, recycled or recovered. |
| Total waste disposed to landfill | tonnes | 12,210 | 16,944 | 17,440 | 73,951 | 20,090 | Waste sent to landfill for disposal typically relates to waste arising from demolition and excavation activities that cannot be treated for reuse, recycling or recovery. |
| Total waste disposed through incineration | tonnes | 194 | 0 | 0 | 0 | 0 | Waste sent to an incineration plant for combustion. Note that prior to 2024/25, this figure included waste sent directly to incineration only. |
| Total waste disposed through other methods | tonnes | 23,258 | 1,581 | 849 |
711 | 396 | Prior to 2024/25, this captured waste sent directly to sewage treatment works only. From 2024/25, the figure covers all disposal operations undertaken by waste facilities, other than landfill disposal or incineration without energy recovery. |
| Construction Waste Generated | tonnes | 45,797 | 104,897 | 100,289 | 87,375 | 101,766 | Total non-hazardous and hazardous construction waste produced by our sites. Reporting from 2024/25 is in line with the Future Homes Hub definition of construction waste including all wastes generated from home building above lowest floor slab level. Prior years’ figures have been updated to reflect this definition for consistency where possible. |
| Construction waste classified as hazardous | tonnes | 181 | 220 | 197 | 306 | 169 | Hazardous waste generation is dependent on project activities during the year. Figures include waste packaging for hazardous materials and used spill response kits. |
| Construction waste diverted from landfill | % | 99.2 | 95.1 | 95.4 | 94.7 | 95.4 | Construction waste generated (including hazardous) that has been diverted from landfill. |
| Construction waste intensity | tonnes/100sqm | 14 | 34 | 28 | 24 | 38 | Construction waste per 100 square metre of legally completed floor area. |
Note: the Berkeley Group introduced an online waste data management system (Qflow) for its 2024/25 reporting. This has led to the below data improvements which should be noted when reviewing present and historical figures:
- Waste weight: in all instances prior to 2024/25, conversion factors were used to translate waste container volumes extracted from waste transfer notes to mass figures. From 2024/25, the online data management system has enabled accurate reporting of mass data based on weighbridge information where available from our contractors. Where unavailable, volume to mass conversion factors continue to be used.
- Waste destination: prior to 2024/25, waste destination reporting was based on the facility type of the initial waste destination. For material recovery facilities (MRFs), a consistent recycling / recovery rate was applied based on the average rate from a sample of MRFs used across the Berkeley Group, with remaining wastes presumed to be taken to landfill. Due to the high variability of recycling / recovery rates for hazardous waste treatment facilities, all waste taken to such facilities was presumed to be taken to landfill. From 2024/25, the online data management system enables more accurate reporting of waste destinations, with facility specific reuse, recycling, recovery and disposal rates applied to each waste transfer based on the facility’s waste returns submitted to the Environment Agency (EA).
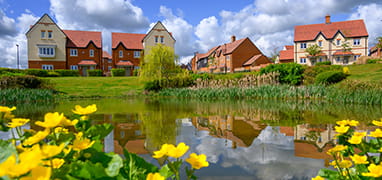
Sustainable Homes
The disclosures below include all legally completed homes in the year, including joint ventures.
| Unit | 2024/25 | 2023/24 | 2022/23 | 2021/22 | 2020/21 | Notes | |
| Homes constructed on brownfield land | % | 92 | 87 | 86 | 86 | 87 | The proportion of homes delivered in the year built on previously developed land. |
|
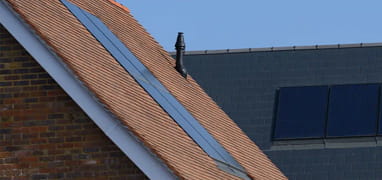
Homes with an Energy Performance Certificate (EPC) energy efficiency rating of at least B
|
% | 95 | 93 | 93 | 89 | 96 |
Each legally completed home has an Energy Performance Certificate (EPC) energy efficiency rating ranked on a scale from A (most efficient) to G (least efficient). This figure outlines the percentage of our homes achieving a rating of at least B.
|
|
Average Energy Performance Certificate (EPC) energy efficiency score of homes
|
# | 84 (B) | 84 (B) |
84 (B) |
83 (B) | 84 (B) | Each legally completed home has an Energy Performance Certificate (EPC) energy efficiency score, based on Government’s Standard Assessment Procedure (SAP) calculations. |
| Homes with an Environmental Impact Rating (EIR) of at least B | % | 96 | 96 | 98 | - | - | Each legally completed home has an Environmental Impact Rating (EIR) ranked on a scale A (low CO2 emissions) to G (high CO2 emissions). This figure outlines the percentage of our homes achieving a rating of at least B. |
|
Average Dwelling Emission Rate (DER) of homes
|
kgCO2/m2/yr | 12.45 | 12.08 | 12.13 | 12.85 | 12.00 |
The average Dwelling Emission Rate (DER) of homes legally completed in the year, based on Government’s Standard Assessment Procedure (SAP) calculations.
|
|
Average improvement in Dwelling Emission Rate (DER) over Target Emission Rate (TER) for homes
|
% | 30 | 32 | 31 | 31 | 33 |
Comparison of the average Dwelling Emission Rate (DER) of homes legally completed in the year, to the Target Emission Rate (TER) which is the minimum allowable standard for the energy performance of a building.
|
| Average internal water efficiency of homes | Ipppd | 102.2 | 101.2 | 102.6 | 104.2 | 104.5 | The average internal water efficiency of legally completed homes in litres per person per day. |
| Homes with internal recycling facilities |
% | 100 | 100 | 100 | 100 | 96 | The proportion of legally completed homes with internal recycling facilities. |
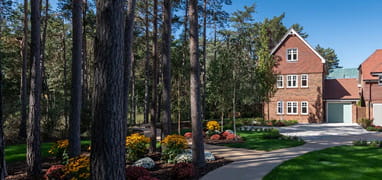
Sustainable Places
Where reference is made to live development sites in the disclosures below, this covers all developments that have an implementable planning consent and that are in production, including joint venture sites.
| Unit | 2024/25 | 2023/24 | 2022/23 | 2021/22 | 2020/21 | Notes | |
|
Developments newly committed to deliver biodiversity net gain
|
# | 2 | 1 | 8 | 6 | 7 |
Each development is a new site which has committed to delivering a biodiversity net gain.
|
| Developments newly committed to deliver biodiversity net gain | % | 100 | 100 | 100 | 100 | 100 | Berkeley has implemented biodiversity net gain for new developments since May 2017. |
|
Developments newly committed to deliver biodiversity net gain on site
|
% | 50 | 100 | 100 | 100 | 100 |
We aim to deliver the biodiversity increase within the site boundary so that the local community experiences the full long-term benefit of an enriched natural environment. Due to the complex nature and required remediation of one new brownfield site in 2024/25, it is currently planned that a biodiversity net gain will be delivered in line with local planning policy and primarily off site.
|
|
Developments newly committed to deliver biodiversity net gain greater than 10%
|
% | 50 | 100 | 88 | 100 | 100 |
The statutory biodiversity metric formula, based on habitat units, is used to calculate biodiversity net gain percentage change values.
In 2021, the Berkeley Group made the commitment to deliver a minimum 10% net gain in biodiversity on every new project. Due to the complex nature and required remediation of one new brownfield site in 2024/25, it is currently planned that a biodiversity net gain will be delivered in line with local planning policy and primarily off site. It should be noted that this site was submitted for planning permission prior to biodiversity net gain legislation coming into force.
|
|
Developments newly committed to deliver biodiversity net gain greater than 20%
|
% | 50 | 100 | 50 | 83 | 71 |
The statutory biodiversity metric formula, based on habitat units, is used to calculate biodiversity net gain percentage change values.
Many of the Berkeley Group’s sites far exceed a 10% biodiversity net gain.
|
| Live development sites regenerating brownfield land |
% | 72 | 75 | 76 | 80 | 77 | Proportion of live development sites that are on previously developed land. |
| Live development sites with sustainable drainage systems (SuDS) |
% | 100 | 100 | 100 | 92 | 91 | Proportion of live developments sites with water management measures such as swales and permeable paving. |
| Live development sites with cycle storage being provided |
% | 100 | 100 | 100 | 100 | 100 | Over 83,000 cycle spaces are being provided on sites under development in 2024/25. |
| Live development sites with electric car charging infrastructure being provided | % | 98 | 98 | 98 | 93 | 84 | Over 10,500 active charging points and 7,000 passive charging points are being provided on sites under development in 2024/25. |